event_model, event_next, event_vis : THE commands to know
For the display, THE commands to know are event_model, event_next and event_vis:
    event_model
    event_next  # have an event, if not done.
    event_vis <event_model_class> [options]
The event_model command lists the event model classes (MCTrack, WCDetectorPoint, FgdDetectorPoint, FgdHit) along their fields known by the little interpreter of the -cut option of event_vis.
EsbRootView_insh$ event_model
MCTrack :
E             m             p             py            t             y
index         mother_id     pdg           pz            x             z
is_secondary  name          px            rapidity

WCDetectorPoint :
Eloss   length  p       pdg     px      py      pz      time    x       y       z
index

FgdDetectorPoint :
Eloss   length  p       pdg     px      py      pz      time    x       y       z
index

FgdHit :
absorbed          dz                photoE            time_stamp_error
added             index             photoEx           x
detector_id       mppcx             photoEy           y
dx                mppcy             photoEz           z
dy                mppcz             time_stamp
For example, you can type (or have in your event.insh script):
event_vis MCTrack -color=red
event_vis MCTrack -cut=(pdg==50000050) -color=red
event_vis MCTrack -cut=(pdg!=50000050)&&(mother_id!=-1)&&(is_secondary==false) -color=cyan -modeling=arrow
event_vis WCDetectorPoint -cut=pdg==50000050 -color=red
event_vis WCDetectorPoint -cut=pdg!=50000050 -color=blue -point_size=4
event_vis FgdDetectorPoint -cut=pdg==22 -pickable=true -color=skyblue
event_vis FgdDetectorPoint -cut=pdg!=22 -pickable=true -color=skyblue -point_size=4
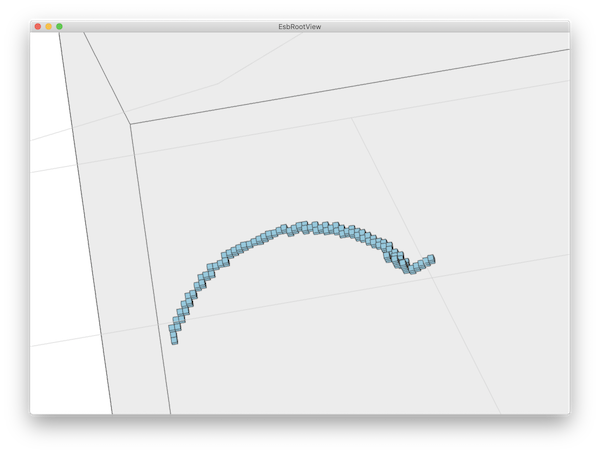
event_vis FgdHit -modeling=cube -color=skyblue # FgdHits represented as cubes in solid.
event_vis FgdHit -point_size=2
The -cut logic applies also for the event_count, event_stats, event_print commands:
    event_print <event_model_class> [options] [fields]

    event_print MCTrack -cut=(pdg==50000050)
    event_print MCTrack -cut=(pdg==50000050) x y z p

    event_count MCTrack -cut=(pdg==50000050)

    event_stats MCTrack -cut=(pdg==50000050) p t
As explained in "help event_stats", event_stats prints the sum/min/max/mean/rms for the fields of the selected objects:
EsbRootView_insh$ event_stats MCTrack x y z p t
MCTrack (49071) sum/min/max/mean/rms with cut "" :
          x         y           z           p           t
    -143933  -24637.4 8.48516e+06    0.310859 7.10046e+06
   -11.0951  -3.47492         150 1.77014e-09           0
 0.00249994   1.95191     191.255         0.2     409.789
   -2.93316 -0.502076     172.916 6.33488e-06     144.698
    3.47884   1.03714      14.448 0.000947268     195.431
style
Each event model class has a default representation which is "point" for MCTrack, WCDetectorPoint, FgdDetectorPoint, FgdHit. You can change the color and point size with the options "-color" and "-point_size" as in:
event_vis MCTrack -color=cyan -point_size=6
You can create also a style, for example in your init.insh file, with:
style_create -color=red -point_size=1 my_MCTrack_style
and then use it in the event_vis command with:
event_vis MCTrack -style=my_MCTrack_style
Note that the graphics attributes passed as options in the event_vis command have priority over the -style. For example with:
event_vis MCTrack -color=blue -style=my_MCTrack_style
the MCTracks will be colored in blue.
coloring
A color can be given in various ways. It can be given by a common color name in the default colormap (for exa "blue"), by giving the name of a color in a known colormap, by giving an hexa encoding or by giving the three or four r,g,b,a (in [0,1]) of the color.
The command style_print_colormaps prints the known colormaps with their colors.
For example to change the background color in scene mode:
    scene_set_clear_color lightgrey
    scene_set_clear_color ROOT/kMagenta+3
    scene_set_clear_color '#FFFF00'
    scene_set_clear_color 0.2 0.1 0.2
or to draw the FgdHit as cube with the "ROOT/kMagenta+3" color:
event_vis FgdHit -modeling=cube -color='ROOT/kMagenta+3'
modeling
An event model class can have multiple represenations or modelings. For example the MCTrack has also an "arrow" representation. You can trigger it with the "-modeling" option as in :
event_vis MCTrack -modeling=arrow
In this case, for each MCTrack, and arrow is added in the dynamic scene graph starting at the fields (x,y,z) and pointing in the impulse direction.
The FgdHit event model class has also the "cube" modeling:
event_vis FgdHit -modeling=cube -color=skyblue