More electromagnetic physics
As this example is intended to be used as an interactive support to detector lessons we are going to play more with the calorimeter example.
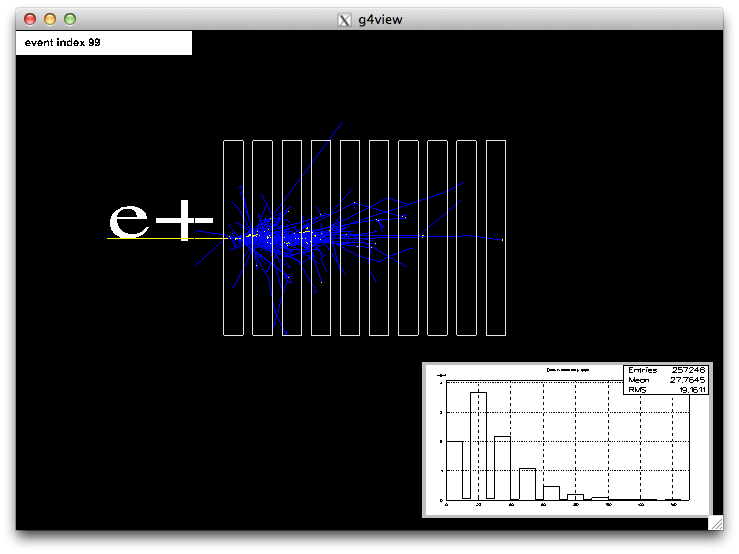
Changing gun energy
You can do that with :
- back to main menu
- examples/calorimeter : to reset the simulation and the histo.
- back to main menu (by using the bottom meta zone).
- set gun
- touch (click) the momentum value (default is 1000 MeV)
- set 100 with the virtual numeric pad. Then Ok.
- Ok in the gun panel.
- start run.
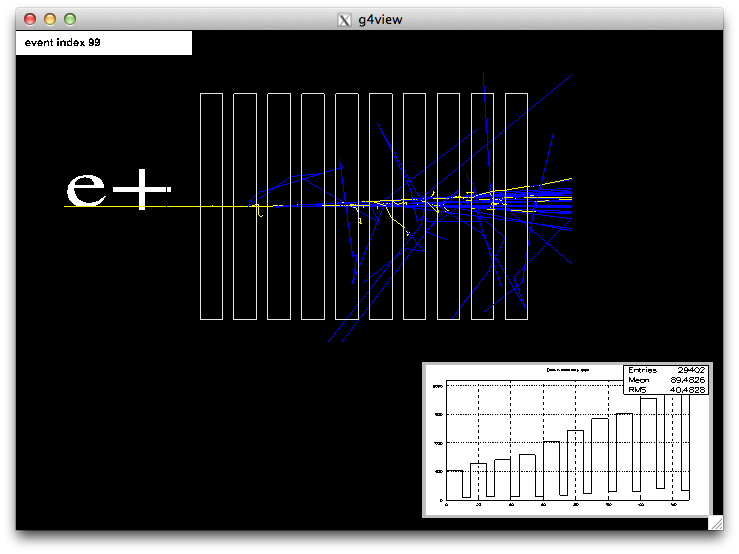
Compared to results in "First run", now the positrons are more quickly stopped by the lead. Good part of the energy is abosrbed in the first and second plate (whilst it was in the third plate with 1 GeV). You should see something as :
Shooting protons
GUI steps :
- back to main menu
- examples/calorimeter : to reset the simulation and the histo.
- back to main menu (by using the bottom meta zone).
- set gun
- touch (click) the particle value (default is "e+")
- choose proton in the list.
- Ok in the gun panel.
- start run.
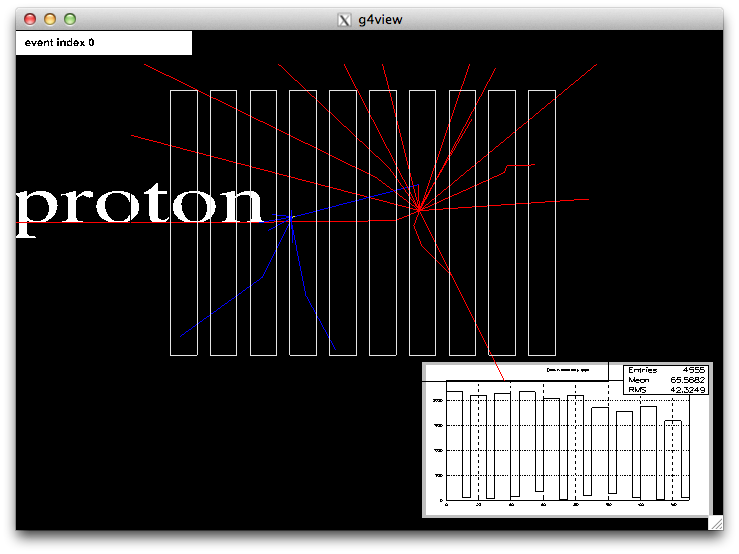
In general proton go straight by only depositing energy through "multiple scattering" with atoms in lead and liquid argon. The histogram is more flat than with eletrons or positrons but with a slight descending slope. From time to time a proton do a nuclear interaction with an atom producing a picture as the below :
Shooting muons
GUI steps :
- back to main menu
- examples/calorimeter : to reset the simulation and the histo.
- back to main menu (by using the bottom meta zone).
- set gun
- touch (click) the particle value (default is "e+")
- choose muon- in the list.
- Ok in the gun panel.
- start run.
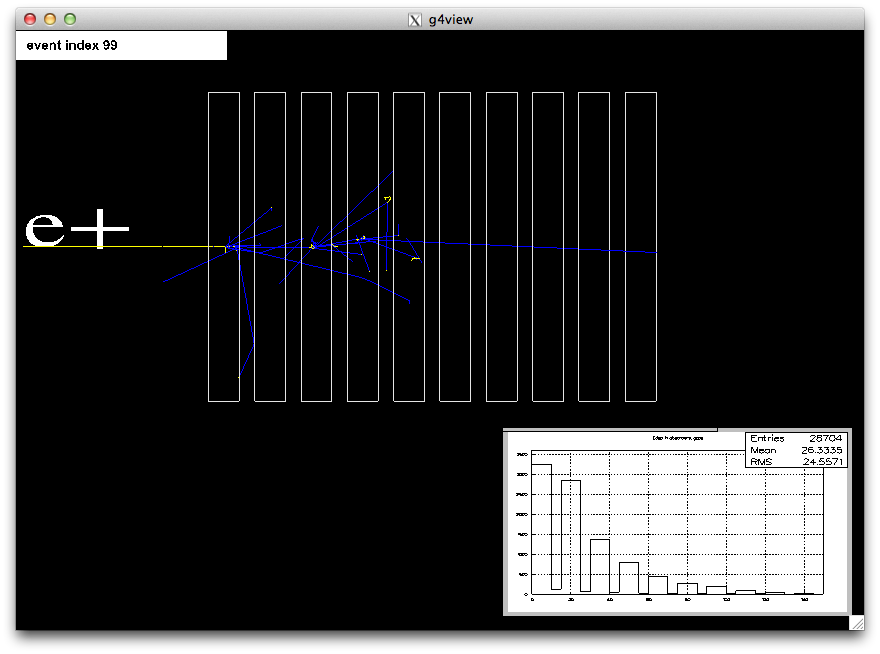
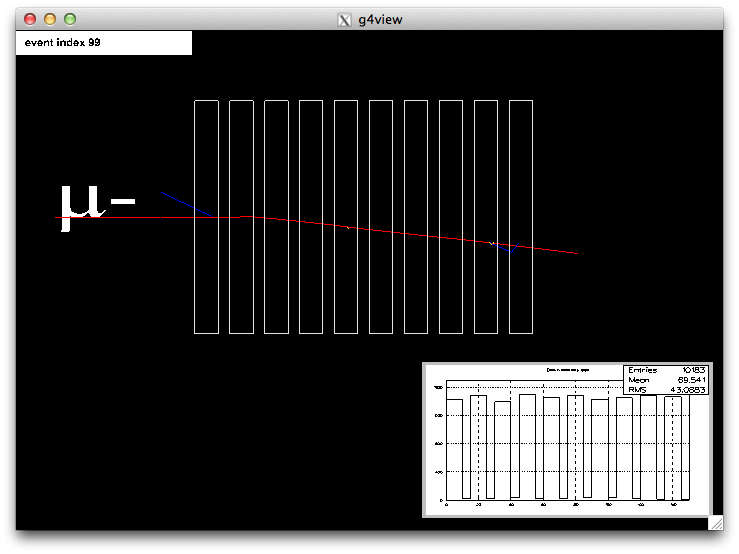
Muons go straight by only depositing energy through multiple scattering and emitting photons by bremsstrahlung. The histogram is even more flat than with protons :
Changing the material of plates
GUI steps :
- back to main menu
- examples/calorimeter : to reset the simulation and the histo.
- back to main menu (by using the bottom meta zone).
- set material
- touch (click) the "absorber" "physical volume" (Geant4 terminology).
- choose uranium in the list.
- home
- start run.
Positrons of 1 GeV are shooted and we see (comparing to "First run") that now most energy is deposited in the second plate (and not the third as in lead). This is due to the higher density of uranium compared to lead.
With aluminium (very light material) we have :