Opening a GDML file
From the main menu, choose "Files" and then ".gdml".
At least the two examples gdml files coming with the app should appear : lhcbhcal.gdml and lhcbvelo.gdml. Select for example lhcbvelo.gdml. You should see :
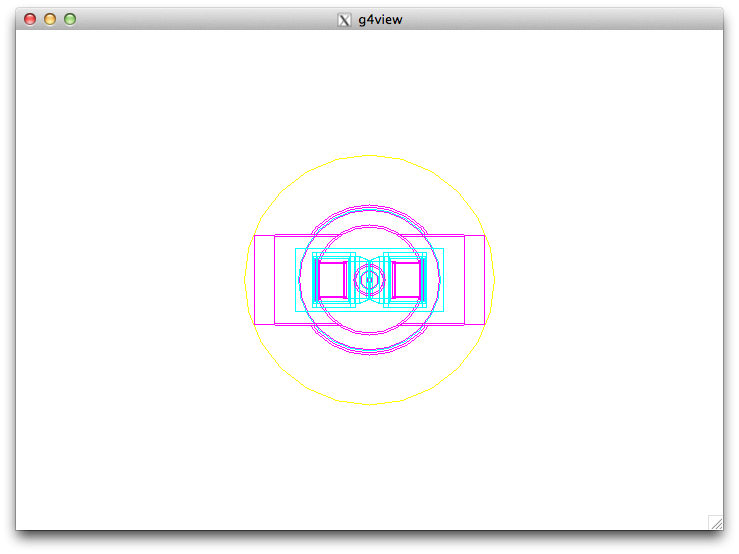
By default, after having read the file and created the Geant4 geometry tree, a visualization in wire-frame is done for the levels "1,2,3" of the geometry tree (then excluding the "mother volume" level 0). Default colors are : leve 1 in yellow, 2 in cyan, 3 in magenta.
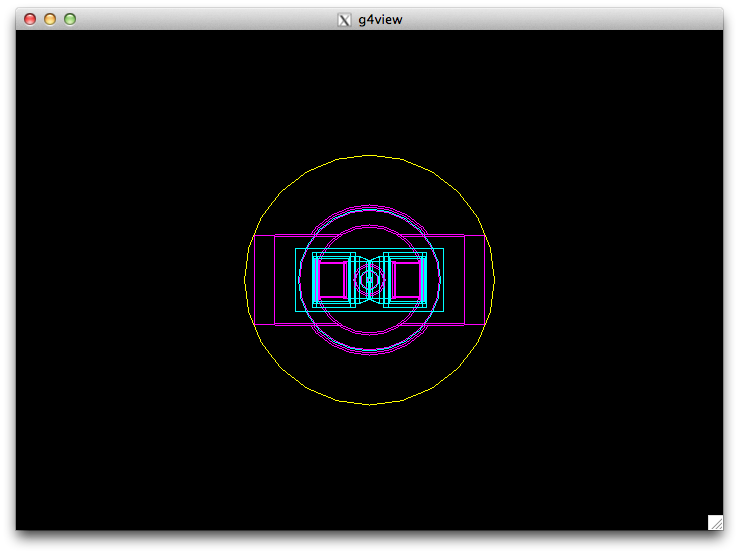
You can change the white background with the GUI steps :
- back to main menu (by using the meta zone).
- params left button.
- go down in the list by using the down arrow.
- touch (click) the background value area.
- Select for example the black color in the color chooser.
- Ok in the color chooser.
- Ok in the parameters panel.
- touch (click) the meta zone to return to the scene.
You can have a top view of the "VELO detector of LHCb" with :
- back to main menu
- camera button at bottom-right
- touch-click the empty bottom-left button in the camera panel to have the "four 90 degrees red arrows".
- click the down arrow.
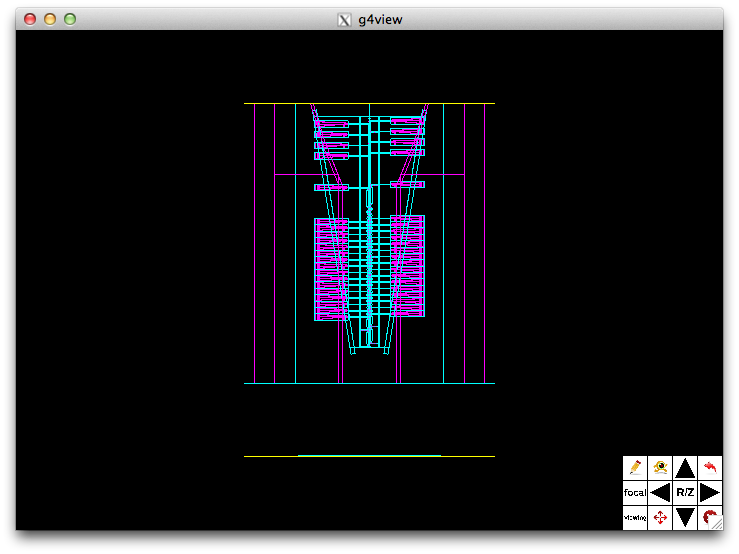
See the "Camera panel" section for more about the camera.
The geom panel
From the main menu, activating the "geom" item leads to a panel permitting to have more interactive customization of a scene graph (sg) created from a loaded geometry tree. For example you can have some solid volumes by doing :
- main menu.
- clear : to delete existing scene.
- geom : to map the geom panel.
- min depth set to 1
- max depth set to 4
- solid depth set to 3
- Ok.
With this setting levels 1,2,3 are visualized with the volumes in the level 3 done in solid.

WARNING: a Geant4 geometry tree could be something fat to process due to the "russian dolls" structure that may induce a lot of volumes. To protect against potential bottlenecks the "max time" item permits to limit the time of the construction of the scene graph (5 seconds by default) and "max shapes" limit the number of shapes (10000 by default).
Various coloring strategies are proposed through the "atb per" item.